Graph showing actual rainfall each October

Graph showing rainfall recorded at the Sanctuary each October from water year 2004 through 2024 (present). The red dotted line is the average.

Conservation

Rainfall and Water Levels October 2023

Rainfall and water levels are below average after a dry summer.

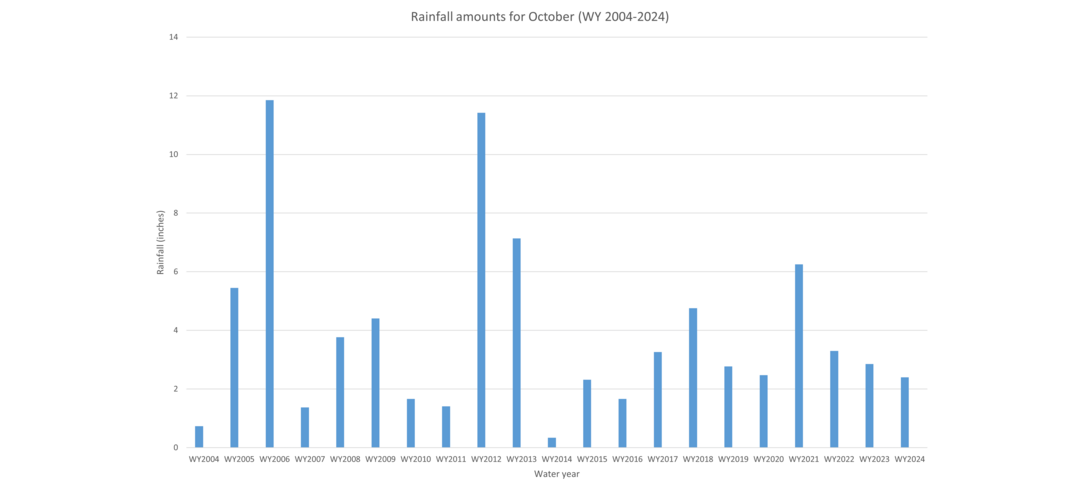
The rain gauge at the Sanctuary recorded 2.4 inches of rainfall in October 2023, which is below the average amount of 3.8 inches typically recorded in October.

Graph showing rainfall amounts each month from June through October, 2023.

From June through October this year, rainfall amounts are 11 inches below average however, water levels are still within “normal” modern range.

Graph showing water levels since 2000
Water level in October, 2023 (red line) compared with water levels from 2000 through present.

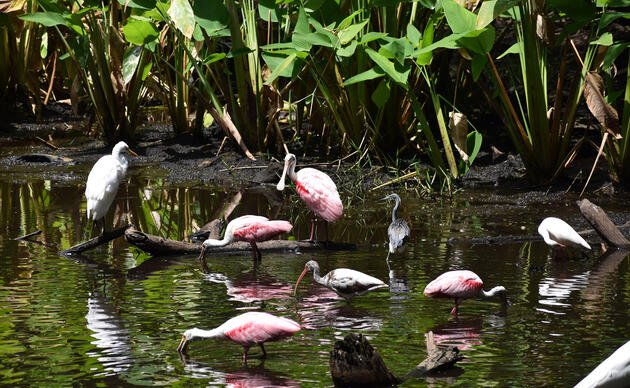
Prey species have spread out in our wetlands and are showing up in our sampling events. 

How you can help, right now